

Science Teachers Sunspot Count Challenge
March 2014 :
General knowledge of basic science concepts and processes is severely lacking among students of all ages in the United States. What I learned in grade school back in the 60s is unfamiliar to many university level students today. This educational disparity is especially true for the science of astronomy, which is the reason why I devote so much of my time enlightening students and the general public about the wonders and beauty of the universe.
With that said, I hereby challenge local science teachers to introduce their students to the most important (for Earthlings anyway) astronomical object in the universe—the Sun. It’s something we all take for granted, but very few students really know anything about our life-giving star, other than it rises and sets and provides light and heat. Adding a semester-long sunspot count project to a science class would be a worthwhile educational experience.
A comprehensive article about the Sun’s origins and activity has been posted on this Science Teachers Sunspot Count Project Challenge webpage. Feel free to use and modify the contents to suit your own requirements. Once your students have gained some insight into the Sun and how it works, the key component of this challenge is to have them safely observe the Sun online to conduct sunspot counts. Please be sure to counsel them never to look directly at the real Sun with the eyes or any instrument such as a telescope or binoculars.
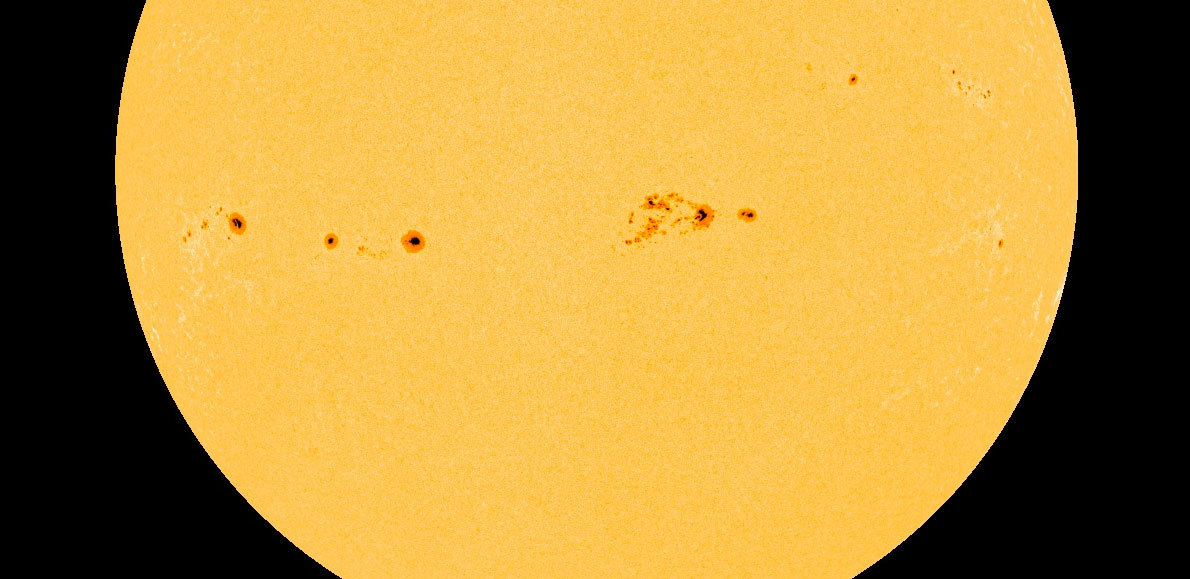
Why is it important to monitor solar activity? The Sun is not the perfect unblemished body it was once thought to be. A casual review of daily solar images will reveal dark spots crossing the solar disk. Solar activity waxes and wanes over an average period of 11 years (called the solar cycle), and the presence of sunspots is a visual indicator of the level of this cyclic activity. By monitoring the sunspots and other related solar phenomenon, researchers can better forecast when the Earth will be affected by increased (or decreased) solar activity.
What are sunspots? Basically sunspots result from very intense magnetic fields breaking through to the Sun’s surface (called the photosphere) from below as twisted magnetic loops with one end having a north polarity and the other end a south polarity. These magnetic fields effectively isolate the region from the surrounding area, causing the area to cool. That is why sunspots appear darker. Clusters of sunspots form intricate groups. Day-to-day changes are easily noted as groups evolve into larger and more complex magnetic clusters or disintegrate and diminish in size and complexity as the magnetic fields break down.
Though the Sun’s energy output usually only varies by a small percentage, solar activity (or the lack of it) can have drastic consequences for the Earth. It is well documented that from 1645 to 1715, the solar cycle was completely disrupted. For 70 years the number of sunspots was incredibly low and did not follow the average 11 year period. In fact, within this Maunder Minimum there was a 30-year period where solar observers recorded only about 50 sunspots total! A more “normal” period would have produced an estimated 40 to 50 thousand spots!
This extended period of solar inactivity coincided with the middle and coldest part of the Little Ice Age in Europe and North America. In Europe starvation was widespread, and in 1709 the Rhine River remained frozen until summer. When the spots returned in 1715 after such a long absence, several scientific papers were written because the phenomena were once again considered unique.
While ground-based telescopic sunspot observations are still being performed by dedicated astronomers today, the Sun is being continually scrutinized by a host of orbital solar observatories. Members of Skyscrapers and I conduct our sunspot counts using solar images from SOHO (Solar & Heliospheric Observatory) obtained at 15:00 UTC (UTC is a worldwide time standard used by astronomers – currently five hours ahead of EST). The HMI Continuum image we examine is similar to a visible spectrum view we would see with a properly filtered telescope. For more details, refer to the Sunspot Count Project Details guide.
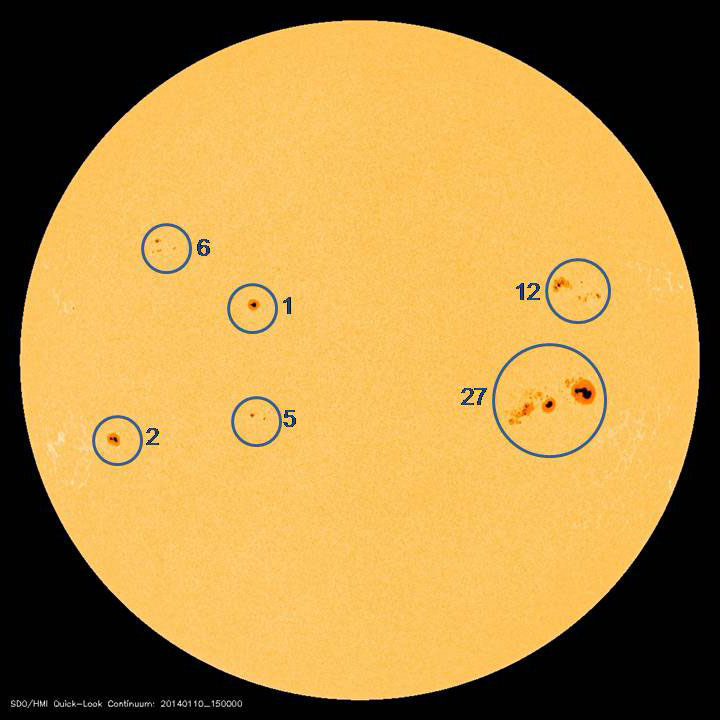
All one has to do is count the number of groups and the number of dark spots. Then you can use a formula developed in 1848 by astronomer Rudolf Wolf so solar observers could uniformly report sunspot numbers. The formula is: R(relative number) = (10 * number of groups) + (number of spots). On the accompanying solar image from 1/10/2014, I have circled the groups and have indicated the number of spots counted. The resulting relative sunspot number would be: (10 * 6) + (6+1+12+2+5+27) = 60 + 53=113. That relative number is then inputted to an Excel spreadsheet and a graph can be created to display the data. Download a sample spreadsheet template to help get you started.
Please see the accompanying graph of the Skyscrapers Sunspot Count Project for 2013. Should this graph or the solar image referenced above not be included with this column due to space limitations, they can be accessed on the Skyscrapers website.
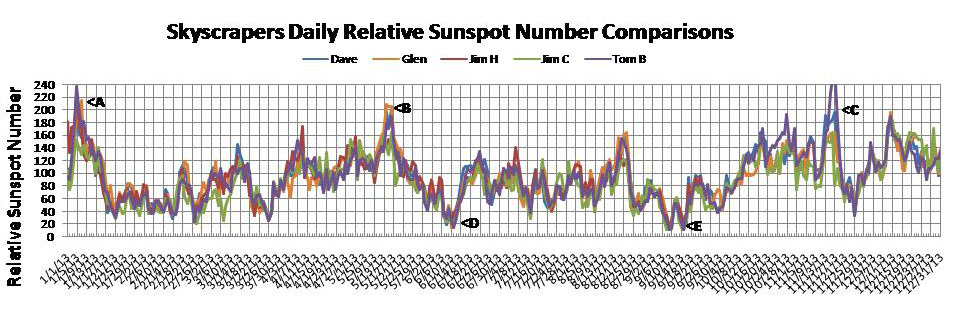
Notice the semi-regular highs and lows. However, note the high around January 5 (label A on the graph). The counts then dropped dramatically and leveled off. Another peak came in mid-May (label B), followed by another decline. During mid-June the numbers bottomed out (label D). Then the counts rose, but not attaining a high level of activity. Then in mid-September the number of spots hit rock bottom (label E). In fact, on September 16, there was only one spot visible on the solar disk. The counts then rose to another plateau (C), though it was not as dramatic as the graph shows. One observer over-counted the number of tiny spots, causing the graph to spike. After that the numbers fell once again. Through the remainder of the year the counts continued their variable high and low cycle of activity, with no extreme peak numbers. The relative sunspot numbers so far for 2014 have remained at modest levels with no peaks like those reported during 2013.
Astronomers have been tracking and numbering the 11-year solar cycle since 1755 with a sequential number starting at 1. Cycle 23 started in 1996, peaked in 2001, and was predicted to end in 2007. It didn’t! New Cycle 24 didn’t begin until January 4, 2008. However, Cycle 24 didn’t “ramp up” as expected. In 2008 there were 266 out of 366 days that the Sun was spotless. This trend continued into 2009 as well. Only as the Sun progressed deeper into Cycle 24 was there an increase in the number of sunspots.
The initial forecast was for Cycle 24 to peak during late 2012. And it was originally predicted to be a large solar maximum. Coincidently, the Mayan Long Count was ending on December 20, 2012 (Mayan Doomsday), prompting many apocalyptic scenarios, including the destruction of the Earth and its inhabitants by a huge solar event.
However, much before the alleged end of the world date, solar astronomers revised their date of solar maximum to May 2013. Not only that, but they also predicted the peak activity to be the lowest since around 1907! They later revised the solar max date again to the fall of 2013. Some researchers believed Solar Cycle 24 could show two peaks. We did observe two peaks in 2013, but only as Cycle 24 continues will we be able to state with confidence that solar maximum has already occurred.
I have been using a sunspot count project for my astronomy lab students at Bryant University for several semesters now. Since the weather usually prevents us from venturing outside to observe, this online observing project provides them with an insight into real science. And in fact, most of them become really good observers.
When inexperienced students first report their sunspot counts, graphed results are all over the chart. However, by the 3rd or 4th week, with feedback from yours truly, the plotted numbers start to merge on the graph as they learn to become better observers. Some students have remarked that they enjoyed the exercise, since they had no idea beforehand that the Sun exhibited this dynamic activity. By the end of the semester many students’ counts were almost identical to mine. And for that effort, extra credit was awarded to the top five observers in each lab.
So please consider accepting my challenge and introduce your students to an “eyes-on” activity that will help them understand our five billion year-old star, which many of us take for granted. Implementing a sunspot counting project can demonstrate that science can be educationally rewarding and fun!
